Hierarchy
Hierarchy: This video contains how to create an Event in Chart.
Only users with Dashboard privilege have access to this section!
Read 5 minutes tutorial here.
Hierarchy used to make Data view in chart, Dynamic view gives you an ability to create a new view as you drill-in each level, which means new information will be displayed in a different view on clicking on a data point.
Example, when you click on a slice of a pie chart it will display bar chart and when you click on a bar in a bar chart it will show a table view etc.
Hierarchy is a drill level, as you can see in below figure from hierarchy tab, you can create hierarchy as you required, and add it from the Chart tab.
Follow the steps to create hierarchy in pie chart.
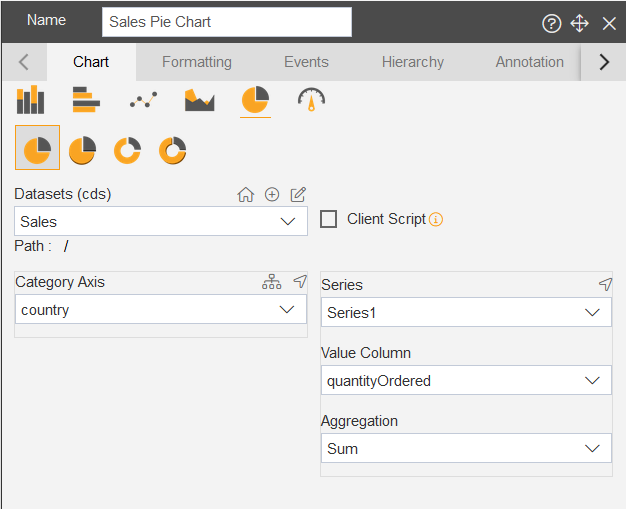
- Select Category Axis and Value Axis, add Aggregation as required. Below figure for example:
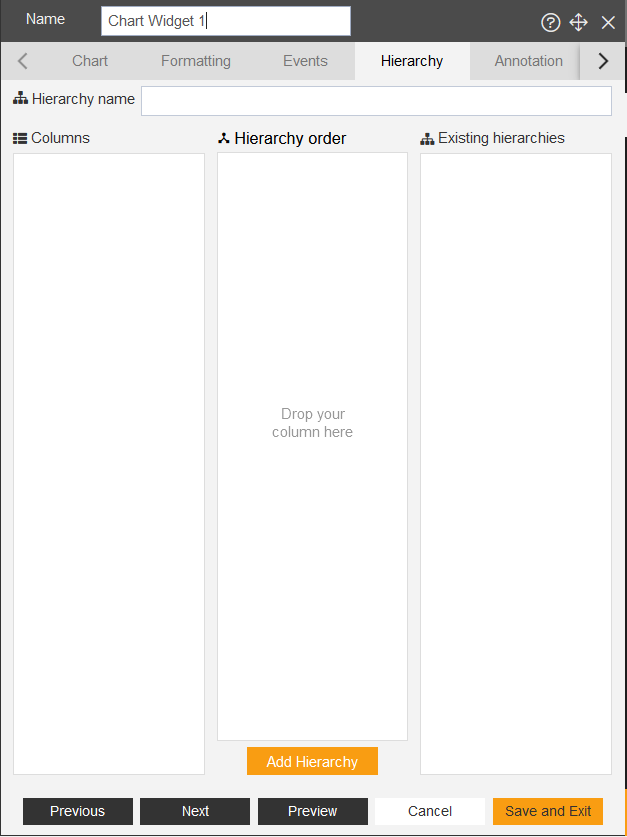
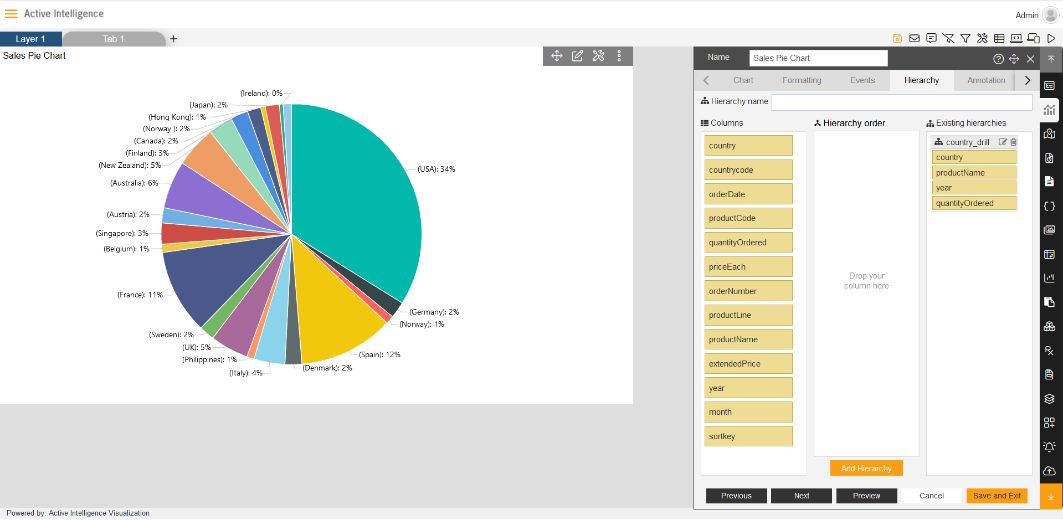
Go to the Hierarchy tab from menu bar in edit box.

You can edit and add required hierarchy name from the Hierarchy Title.

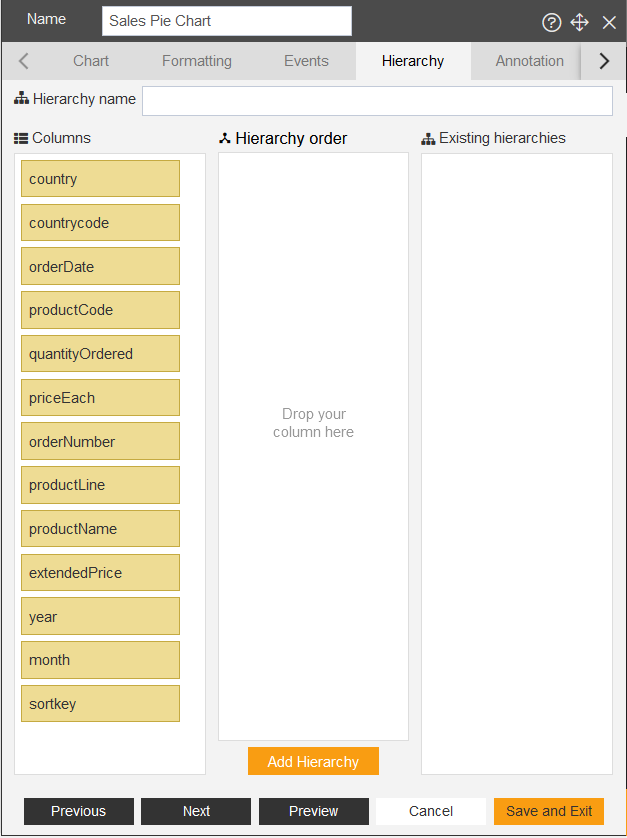
As you reach to the Hierarchy tab, you will see the Category tab’s values filled in column’s box. As shown in figure below:
Now, Drag and drop required columns from Column’s box to Hierarchy order box, As shown in figure below:
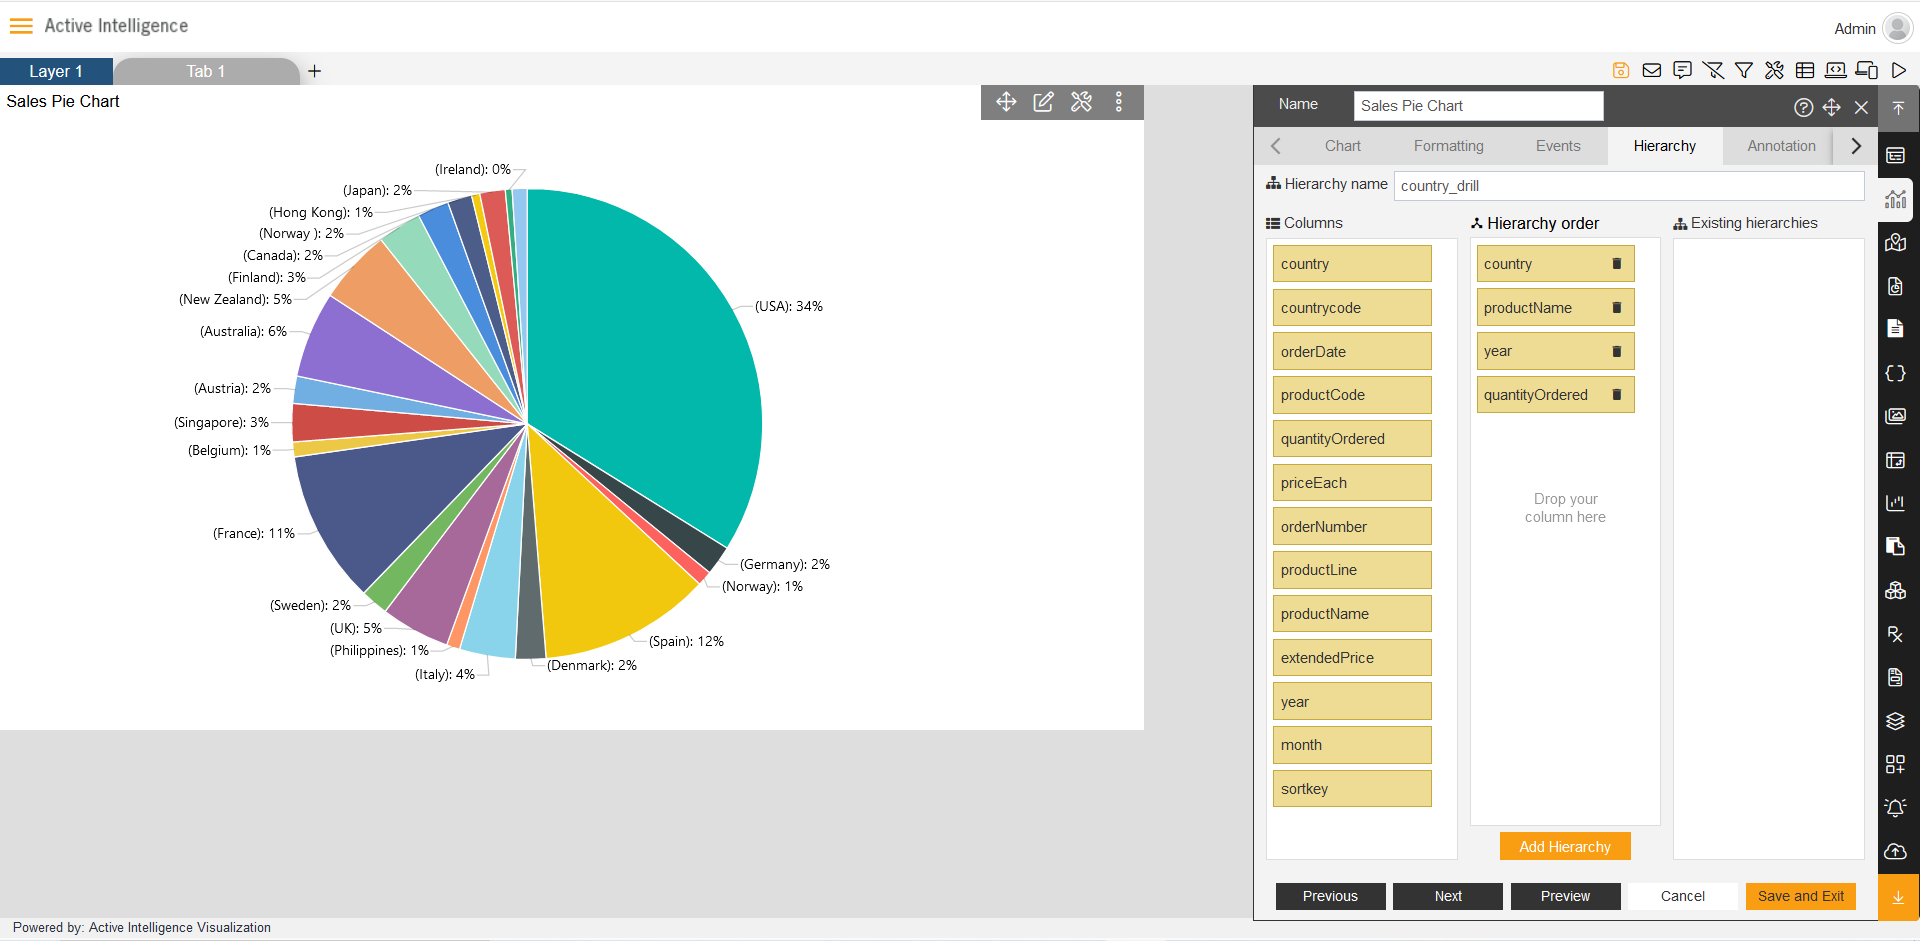
As user add columns into hierarchy order, the title control will make title automatically which would be depend on user selected data.
Now click on the Add Hierarchy button to save hierarchy, as shown in figure below.
Apply the Hierarchy to the Chart, go to the Chart tab and click on the Category Axis, you’ll find the Hierarchy in the list of category Axis, as shown in figure below:
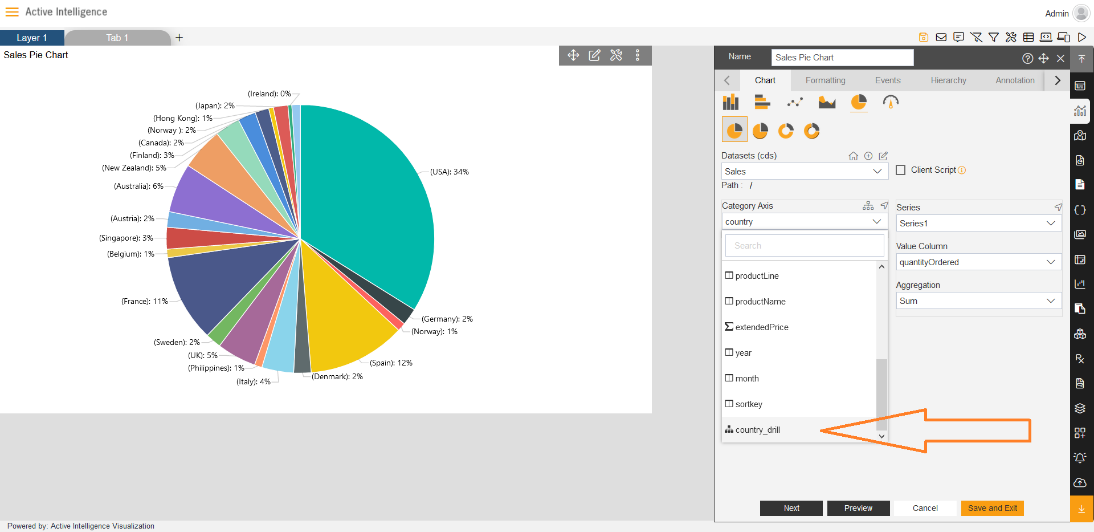
Click to select hierarchy column and apply the dynamic view in pie chart.
Close the edit box by clicking on Save and Exit button. Go to Preview of dashboard by clicking on the Preview icon.
Now, as you click on the slice of pie chart, the dynamic view will take from the one level of values to another level, as shown in figure below:
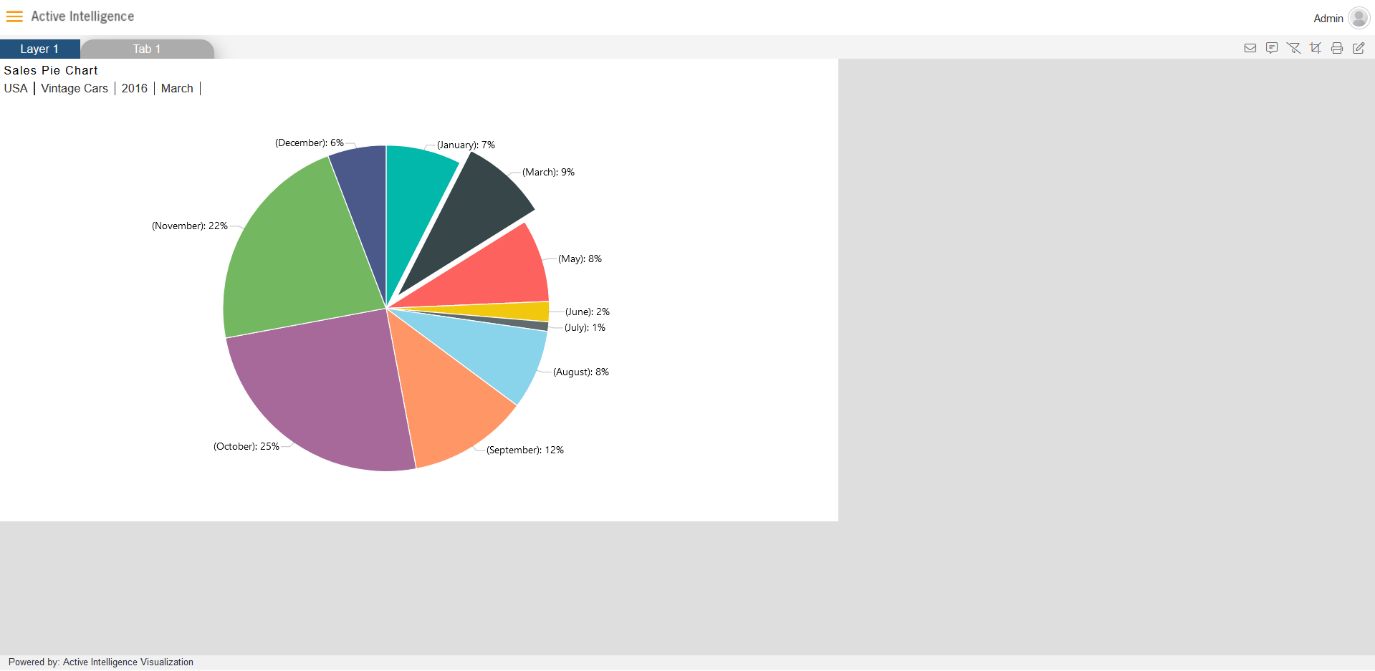
As you click on the slices of pie and drill into a chart, the level of Dynamic-view will be visible on the top-left side of the pie chart.
✒️ In order to understand in detail about other features, click on the following links:-